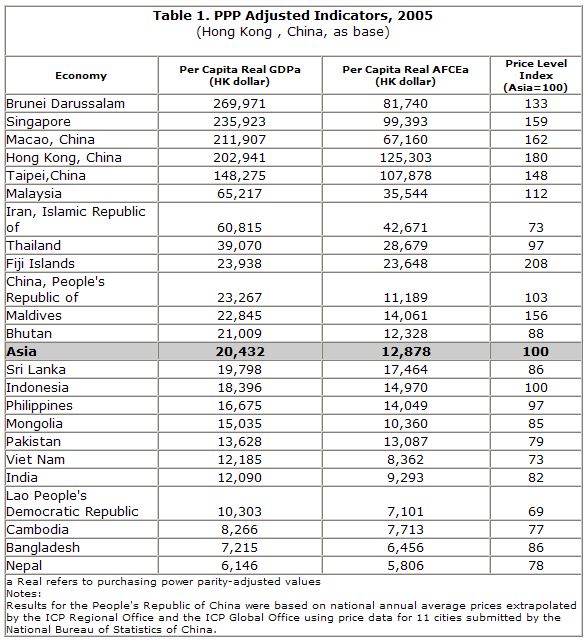
The study, which provides a snapshot of economic measures like income, consumption expenditure and capital formation, is part of a global initiative that allows cross-country comparison purchasing powers of currencies and living standards. The ICP, which was coordinated globally by the World Bank, will allow comparison of major economic indicators for 146 countries globally. The Asian Development Bank (ADB) was the regional coordinator for the ICP Asia-Pacific, which accounts for half the world’s population. Statistical organizations of the region actively participated in this initiative.
Purchasing Power Parity (PPP) is an idea popularized by The Economist’s Big Mac Index, which prices hamburgers in global cities for a quick and crude comparison of inter-country price levels. The ICP is an attempt at a cross-country comparison of key economic indicators based on PPP and provides the most comprehensive cover of a broader range of commodities.
For the first time, the People’s Republic of China (PRC) and India – which together make up 64% of the total real GDP of the 23 economies participating in ICP Asia-Pacific – simultaneously joined this regional initiative to estimate the purchasing power parities of currencies.
However, data collection and price estimation, especially when nationwide price data are not available, of various components of an economy’s consumption basket pose challenges for measurement of PPP.
“The data and the results should be interpreted carefully. It is the beginning of a global and regional effort, which, in turn, will improve the robustness of future PPP estimates,” says Ifzal Ali, Chief Economist of ADB.
The richest economy, Brunei, has a per capita GDP more than 13 times the regional average and more than 40 times larger than the lowest ranked economy, Nepal, says the study.
India, one of the fastest growing economies in the region, has a per capita income lower than the regional average, behind its neighbors Sri Lanka and Pakistan. The PRC, the region’s growth engine, has above-average real per capita income.
According to ICP, however, both the PRC and India still lag the regional average when ranked in terms of Actual Final Consumption Expenditure (AFCE). The AFCE is the sum of individual consumption expenditures both by households and by government (principally education and health) and is the best available measure of household living standards.
The economies with the highest AFCE Indices are Hong Kong, China, Taipei,China, and Singapore. The economies with the lowest AFCE Indices are Nepal, Bangladesh and Lao People’s Democratic Republic.
The study highlights the huge inequality in living standards among Asia-Pacific economies, excluding Japan and South Korea. The per capita real AFCE in the highest economy, Hong Kong, China, is 22 times as great as that in the lowest economy, Nepal.
“The study shows the growth and developmental challenges facing the region,” Mr. Ali says. “The region has miles to go before celebrating its economic success.”
In terms of Gross Fixed Capital Formation (GFCF), which is an indicator for the economy’s potential for future growth, the richer economies generally invest more on a per capita basis than poorer economies, the study shows. GFCF tracks investments in residential and other buildings, roads, bridges, railways, electricity networks as well as purchases of machinery and equipment in an economy. The PRC fared slightly above the region’s average, while India ranked below the average level.
Based on the Price Level Index, which is the ratio of the PPP to the exchange rate, Fiji Islands and Hong Kong, China, are the costliest places to live. They are followed by Macao, China; Singapore; Taipei,China; and Maldives.
PRC ranked ninth on the Price Level Index list, while India ranked 17th on the list.


